Understanding the Dashboard
Last updated January 10, 2024
Dashboard is a visual report that gives you a clear idea of how your campaigns are progressing. It measures the performance of your campaigns with respect to certain parameters and presents it in an easy-to-understand format. To understand the parameters tracked for every campaign, refer to the article Breaking down the KPI’s .
This article will tell you about all the information you can get from the dashboard using its different features.
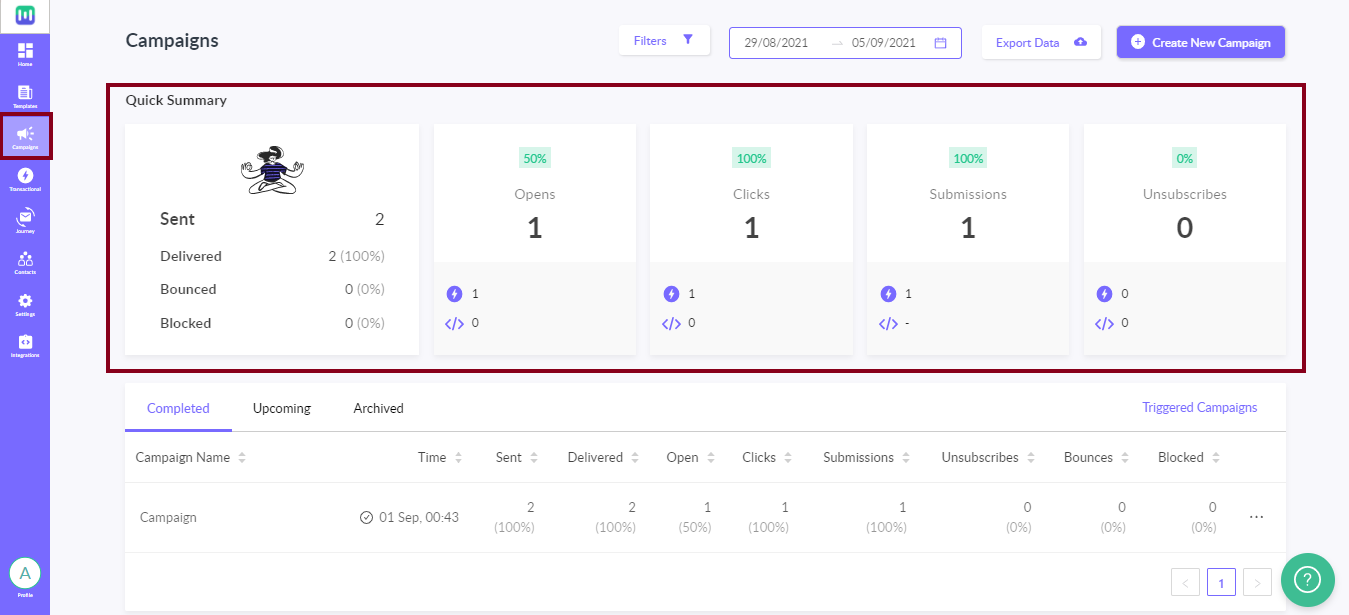
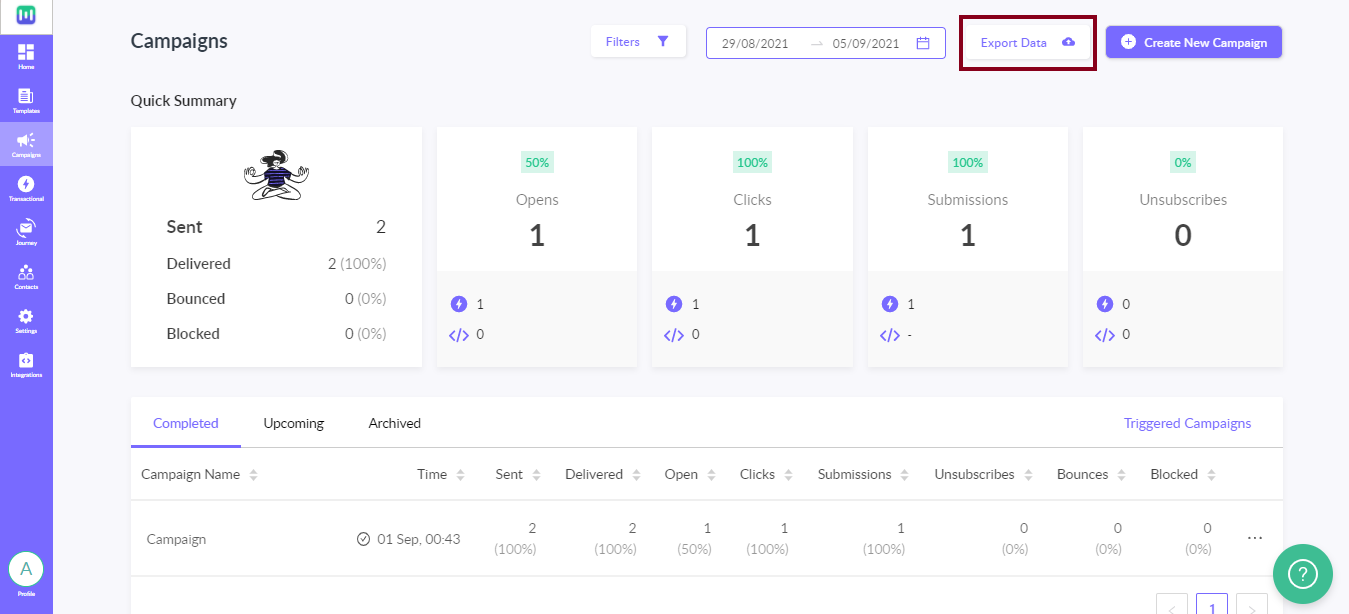
Step 1: Click on the ‘Campaigns’ icon on the sidebar and the dashboard page will open.
There is a Quick Summary that gives you a cumulative report of all campaigns sent. This tells you of your company’s total outreach with all your campaigns combined.
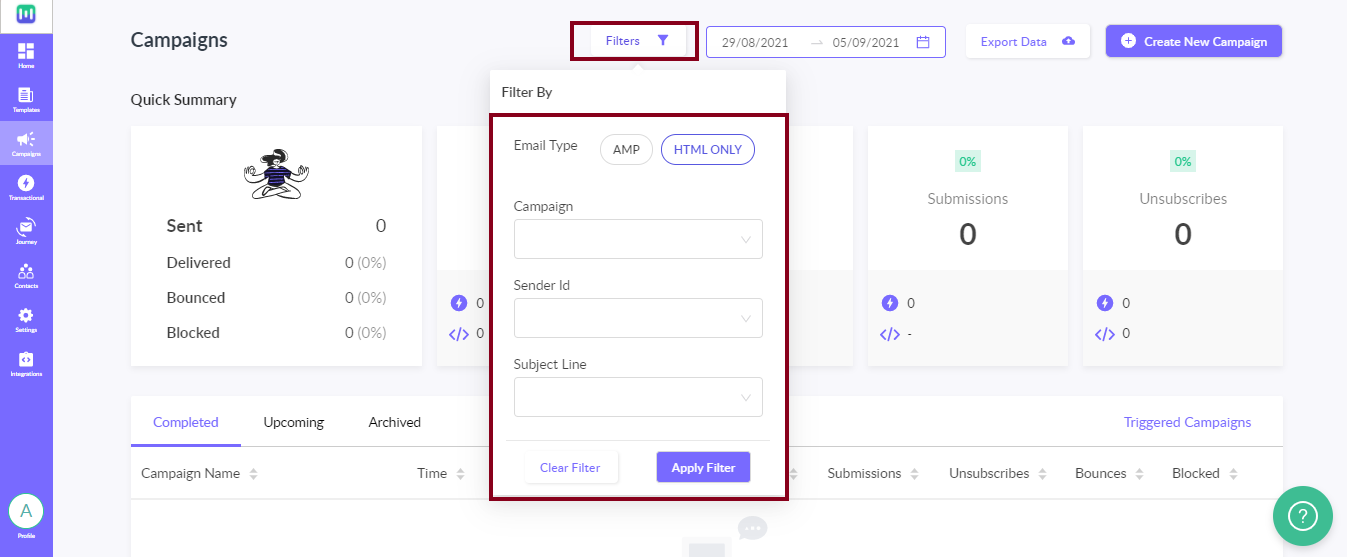
Step 2: Apply filters by clicking on the ‘Filter Icon’ to get a more specific report as per your requirements.
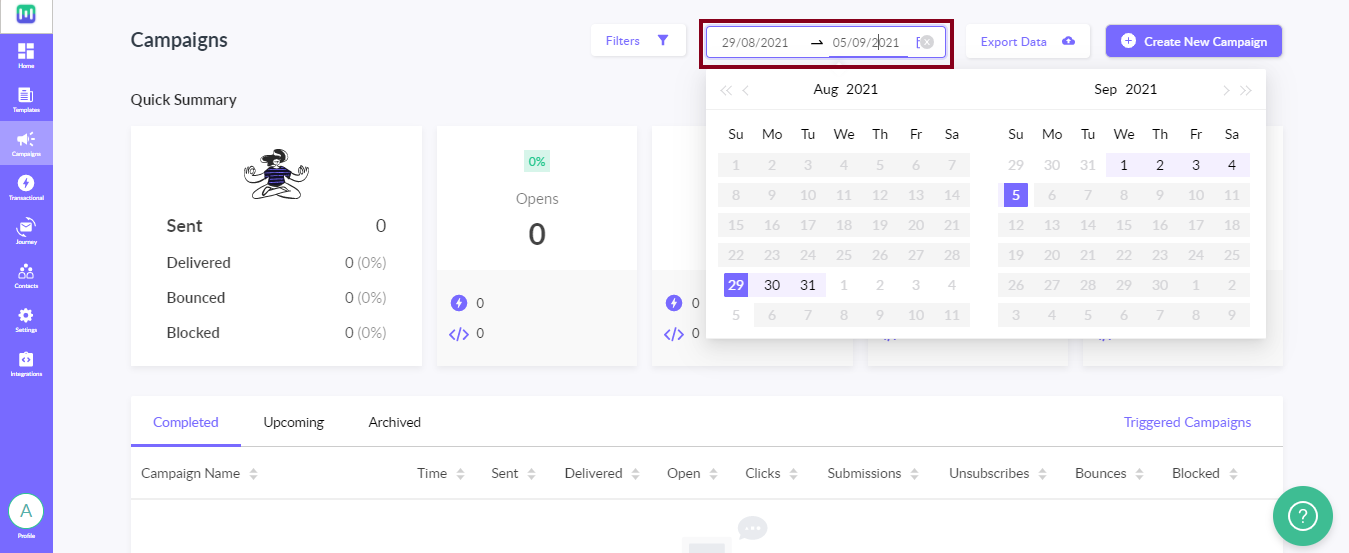
Step 3: If you want to see the overall performance of your campaigns over a particular period of time, enter the dates in the given calendar.
Step 4: You can also export the data in the form of .csv files by clicking on the ‘Dot menu’ on the right and select Export campaign data.
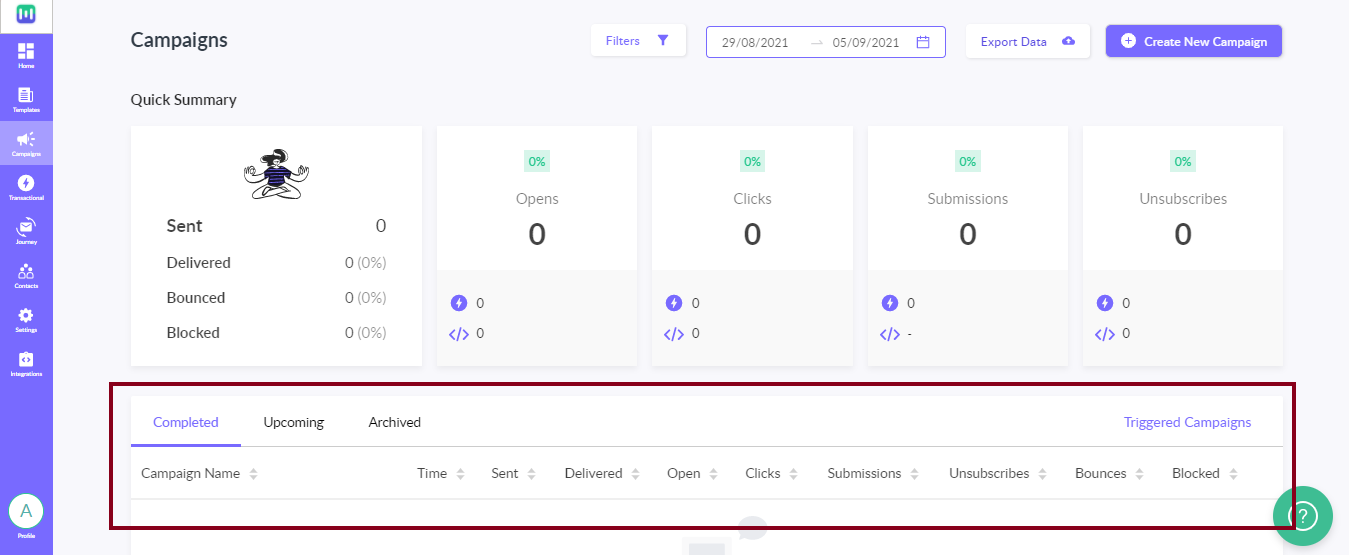
Below the Quick Summary, is a campaign-wise list that breaks down the performance of each campaign.
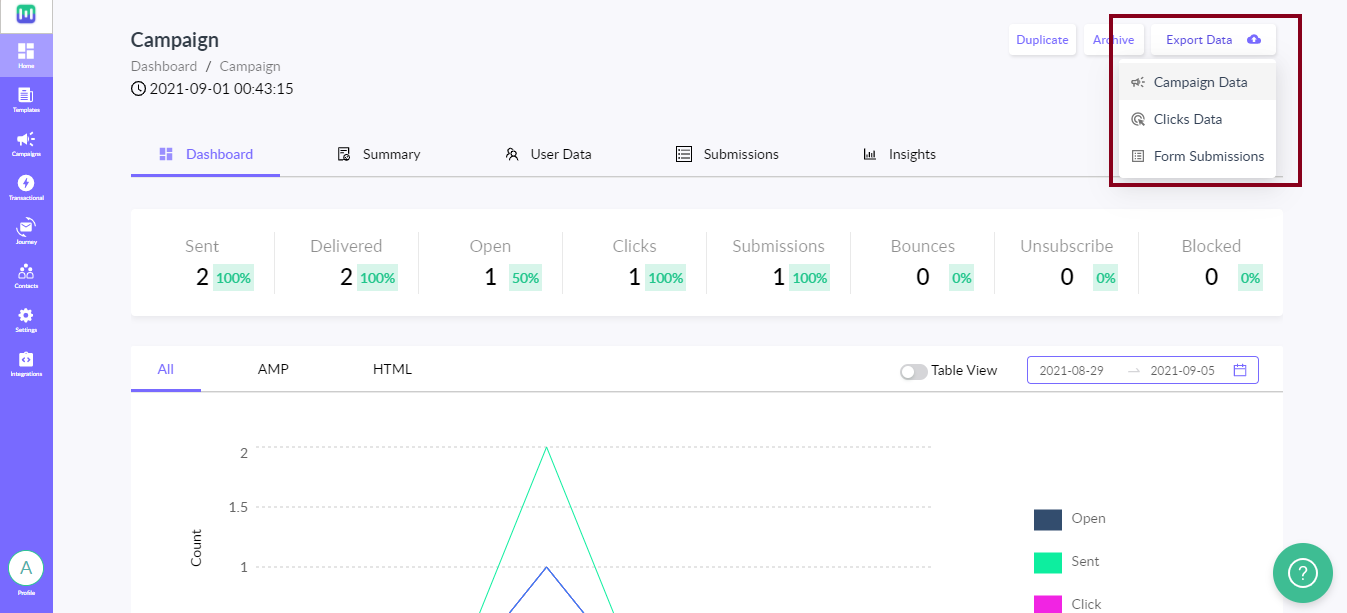
Step 1: Click on a particular campaign and you will get a detailed summary of that campaign.
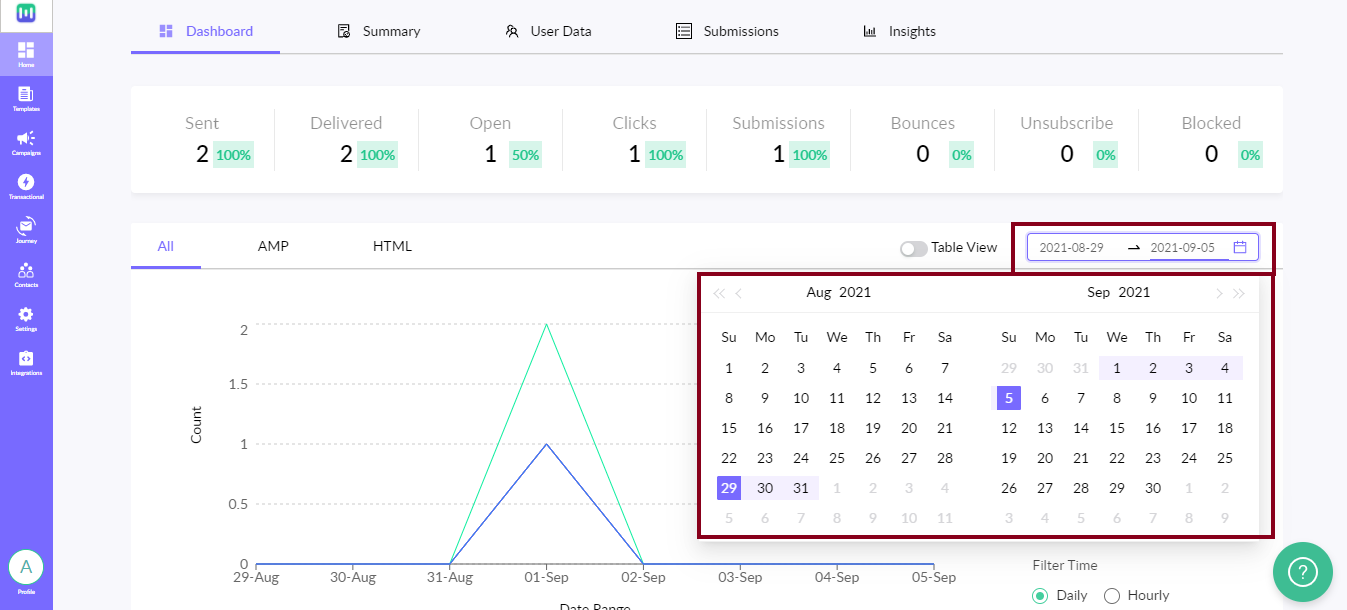
The Dashboard tab gives a graphical presentation of your campaign’s performance over a period of time.
Step 2: Add dates in the given calendar to specify the time period over which you want your campaign report.
Further on, you can also see the performance of the HTML mails and AMP mails separately. The dashboard also provides you with a Recipient List Analysis.
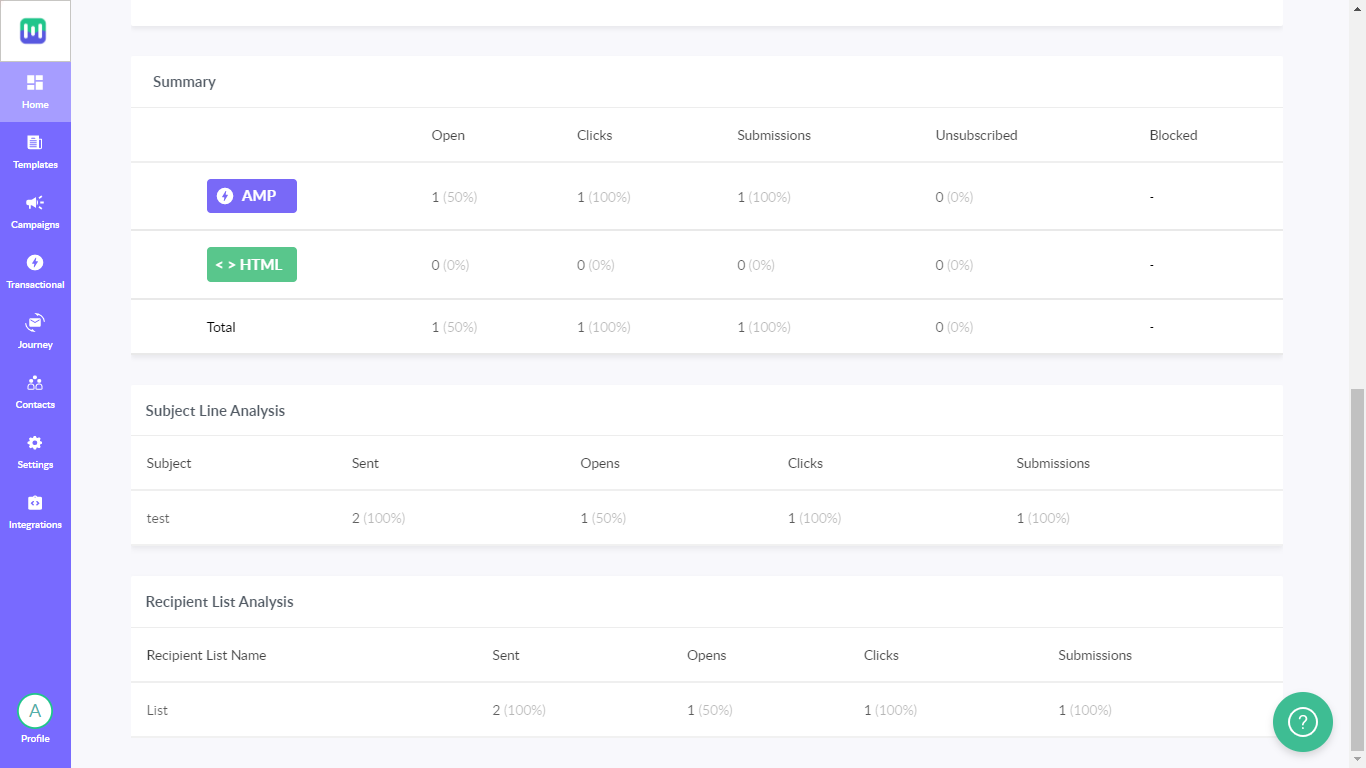
The Recipient List Analysis only works when the campaign is sent to multiple recipient lists.
Step 3: To export data for a specific campaign, click on the ‘Dot Menu’ button on the right. A drop-down list will appear and select Export data. You can get reports for Campaign Data, Clicks data, Form submissions and Bounce Data.